
 It seems that we are awash in data in education, especially edtech, lately. I’m a big data junkie, so I find it tremendously exciting. With the advances in technology we have the opportunity to collect real-time performance data at a level of detail that just wasn’t possible before. And with good data and people who understand what those data mean, well, the possibilities just seem endless for how we can improve and individualize instruction for kids.
But something has been nagging at the back of my mind for a while now about all of these data. It’s not the usual thing…I’m not particularly concerned about privacy. I don’t spend time worrying about the commoditization of learning. And I don’t buy into the conspiracy theories about the so-called “big data” companies getting rich off the backs of kids and teachers.
What I do think about are the abilities of the people who are analyzing and reporting on those data to really understand what the data mean. I wanted to share three stories of data misuse or misinterpretation that I’ve encountered over the course of my career to give you an idea of why this concerns me. Needless to say, some of the details have been modified slightly to protect people’s identities.
Story 1- Some time ago I consulted to a large edtech company about their content. The software engineering team was creating a digital gradebook into which activity scores would be stored automatically. I met with the team when they were designing the gradebook. I was very specific with them that they needed to store raw data in the gradebook. So about a month later one of the engineers came to talk to me about a problem he was having with the gradebook. Some of the grade tallying wasn’t making sense to him, but he couldn’t figure out what was wrong. We talked for a while and after a series of questioning, it turned out that the issue was that for each activity the gradebook calculated a percentage correct and then, for the global result, the gradebook was set up to average across percentages. My mind was blown, for two reasons: first, because I specified to the team, in advance, that they needed to use raw data. Second, because these software engineers are not dumb. I specifically asked this engineer, “Would you ever convert raw data to percentages in your code and then use percentages?” He was alarmed by such a question because he clearly never would do that…it is fraught with potential mathematical inaccuracy. “Right,” I said. “And the same thing is true here.” (Usually, in my experience, averaging across percentages overestimates performance.) He agreed that it was just as mathematically incorrect in the gradebook as it would be anywhere else. I asked why they had implemented it that way. And that’s when he said something really disturbing to me: “Well, that’s the way all of the other competitors’ digital gradebooks we looked at do it and so we were told to do the same thing they did.” Yeah. Just imagine that…there is some proportion of digital gradebooks wandering around in edtech that average across percentages. If you’re a teacher using a digital gradebook, I suggest you run a simple test to make sure that it’s calculating grades accurately.
If you think I’m being too persnickety here, think of this scenario: Activity 1 had 10 items and the learner scores 9 out of 10, or 90%. Activity 2 has 50 items and the learner scores 8 out of 50, or 16%. Now, if you average across percentages the total score would be 53% correct. If you use the raw data then the learner would score 17 out of 60, or 28%. It’s a big difference. That’s why it matters.
Story 2- A bunch of years ago I had a research faculty appointment at the University of Kansas. We were doing classroom-based research looking at the social interactions between kids and teachers and between kids and peers. We had staff who observed the interactions in the classroom and coded them in real-time, using very early hand-held computers (old NEC mobile PCs, remember those??) We had tons of data coming in every day and I spend a LOT of time with those data and had primary responsibility for analyzing them. So I was asked to come and consult to a lab at another university that was conducting similar research. Like us, they observed for 30 minute sessions and, like us, they recorded event data on handheld devices. They asked me to come in because they couldn’t make heads or tails of their data. The lab was run by two PhD faculty members and a team of doctoral students. They had already had one other PhD level consultant in who couldn’t help them. So I went in and took one look at their data and knew exactly what the problem was. Here’s the explanation: When we analyzed the data we converted them into rates per minute so that we could compare across days in a standard way. What I knew from my own lab was this – if a behavior only occurred one time during a half hour observation then the equivalent rate per minute was 0.03 (1 divided by 30).
When I looked at these data from the other lab they were showing rates like 0.00056 per minute. That rate isn’t possible. If a behavior occurred zero times in 30 minutes, the rate per minute is 0. If it occurs once, the rate per minute is 0.03. So what the staff in that lab had been doing was converting to a per second rate. They correctly divided 1 by 30 to get a per minute rate, but then they divided again by 60 and ended up with a per second rate. The project had been going on for over a year and no one had caught this mistake. And by converting to a per second rate the rates of behavior were so low that the team thought they didn’t have any meaningful results. Once we multiplied their data back out by 60, all kinds of patterns popped out of the data that they just couldn’t see before. So how did this happen? Again, these are smart people….at least 3 PhDs and a bunch of doc students. But nobody saw it because they weren’t thinking through what the data meant.
Story 3- One last example and this one is straight from an app that I’ve reviewed, though I won’t tell you which one. Here’s the scenario:
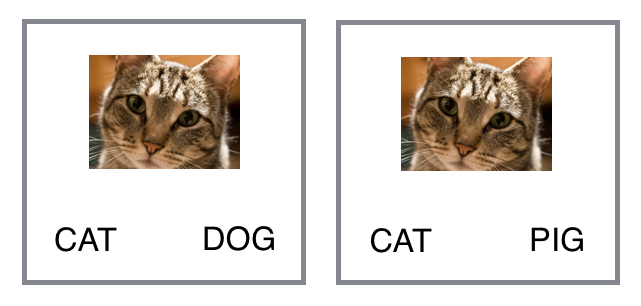 The learner’s task in this problem is to select the word that matches the picture. In this particular app there are performance reports included, broken down by concept. So I wanted to see how the reporting worked. Here’s how I distributed my responding with these two examples: when the cat picture was presented with the words cat and dog, I got the answer correct 50% of the time (which is chance level performance when 2 possible answers are available). When the cat picture was presented with the words cat and pig, I got the answer correct 100% of the time. Here’s where things get messy: the performance report said that I had 75% accuracy with the concept “Cat.” So let’s just forget about the fact that we don’t know for sure how that 75% was calculated (see story #1, above). The bigger problem is this: with my answers distributed the way they were the program should have concluded is that I don’t know “Cat” at all. Why do I say that? Because I had chance performance on cat vs. dog, showing that I don’t know “Cat” or “Dog.” The 100% accuracy on cat vs. pig is irrelevant because when we examine that in the context of the cat vs. dog results we can very easily conclude that the 100% accuracy is a result of my knowing “Pig.” Think of it this way: in cat vs. pig I may not be choosing “Cat,” but rather I may be choosing “Not Pig.” Does this make sense? We would want to have other problem types comparing dog vs. pig to test this. But the point here is that unless we understand what the data mean then we can’t report on them meaningfully.
I think there are two main ways that edtech companies can protect against misuse and misinterpretation of data: the first is to be as transparent as possible about how they’re treating and transforming raw performance data under the covers (or better yet, provide the raw data for educators to see as well as any transformed data). The second is to explain to users what the results mean, if they are aggregated in a way in that obscures the details in a report. Alternatively, the app could allow users to drill down to more detailed levels of the data (for example, the Cat example I gave above would benefit from this).
We’re able to collect more data about learner performance now than at any other time in history. To me, this presents awesome opportunities. But the opportunity is only as good as are the people involved who understand what questions to be asking about data and what those numbers actually mean. And even if those people are very smart, they need to have their thinking brains on when they are evaluating data. As educators, these are the conversations we really need to be having with edtech companies…snazzy graphics and kids having fun with edtech products simply doesn’t make up for poor treatment of data. And while we’re all running around being worried about privacy and conspiracies, what we really should be worrying about is whether or not the data presented in performance reports is telling us anything meaningful at all.
Do you have any scary misuse of misinterpretation of data stories to share? Or do you know of an edtech company that’s doing a really good job of being clear and transparent with student performance data and presenting it in a way that is useful and actionable for teachers? Please share!


Reblogged this on Make Sure You're Comfy =).
Pingback: Educators Are Worried About the Wrong Thing Wit...
Pingback: inBloom & Net Neutrality: I’ve Got the Blues | disrupt learning!
Pingback: Educators Are Worried About the Wrong Thing Wit...
Pingback: Educators Are Worried About the Wrong Thing With “Big Data” | Big Enterprise Data